The world around us is a graph.
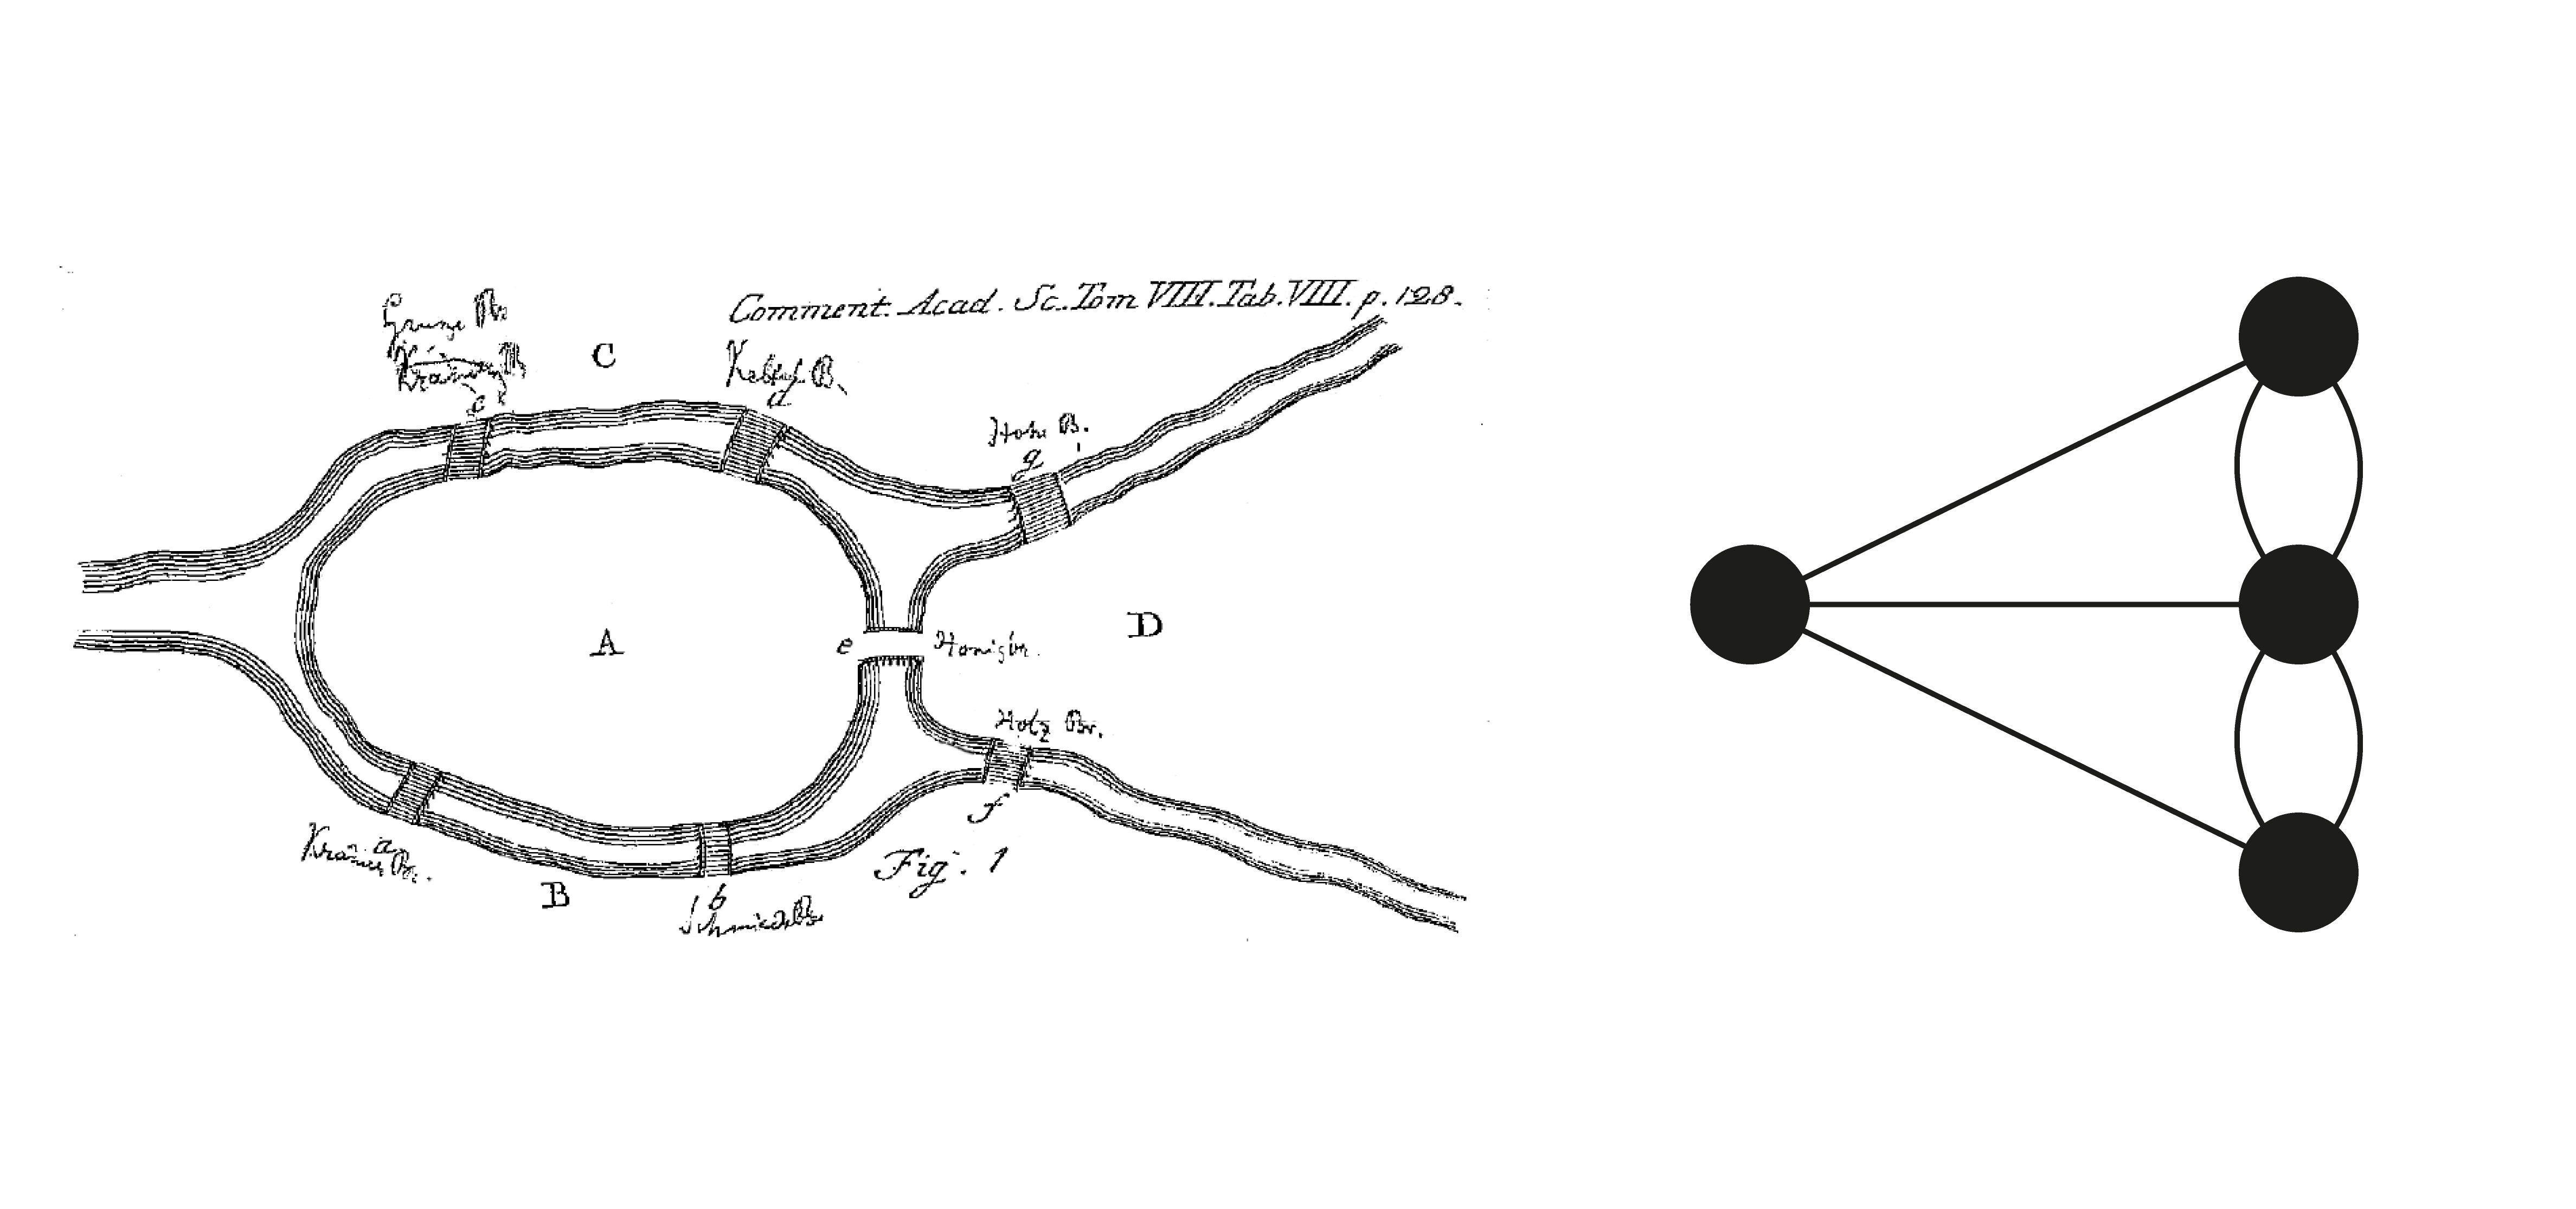
Well, that’s at least what 18th century mathematician Leonhard Euler thought when he came up with graph theory to solve a long-standing argument about the seven bridges of Kaliningrad, the question being: “Can we walk through all parts of this city, crossing each of its bridges exactly once?” (Spoiler alert: no.)
Long story short, he came up with the idea of representing the entire, complex city in a diagram — each point representing a part of the city, and each line a relationship between parts, in this case a bridge. This approach allows us to represent any complex network in a simplified way and makes it easy to identify possible routes.
Many years later, it was Harry Beck’s background in electric engineering that inspired him to simplify the complex geographic Tube map and turn it into a diagram that looked like a circuit board. And what is a circuit board, if not a graph?
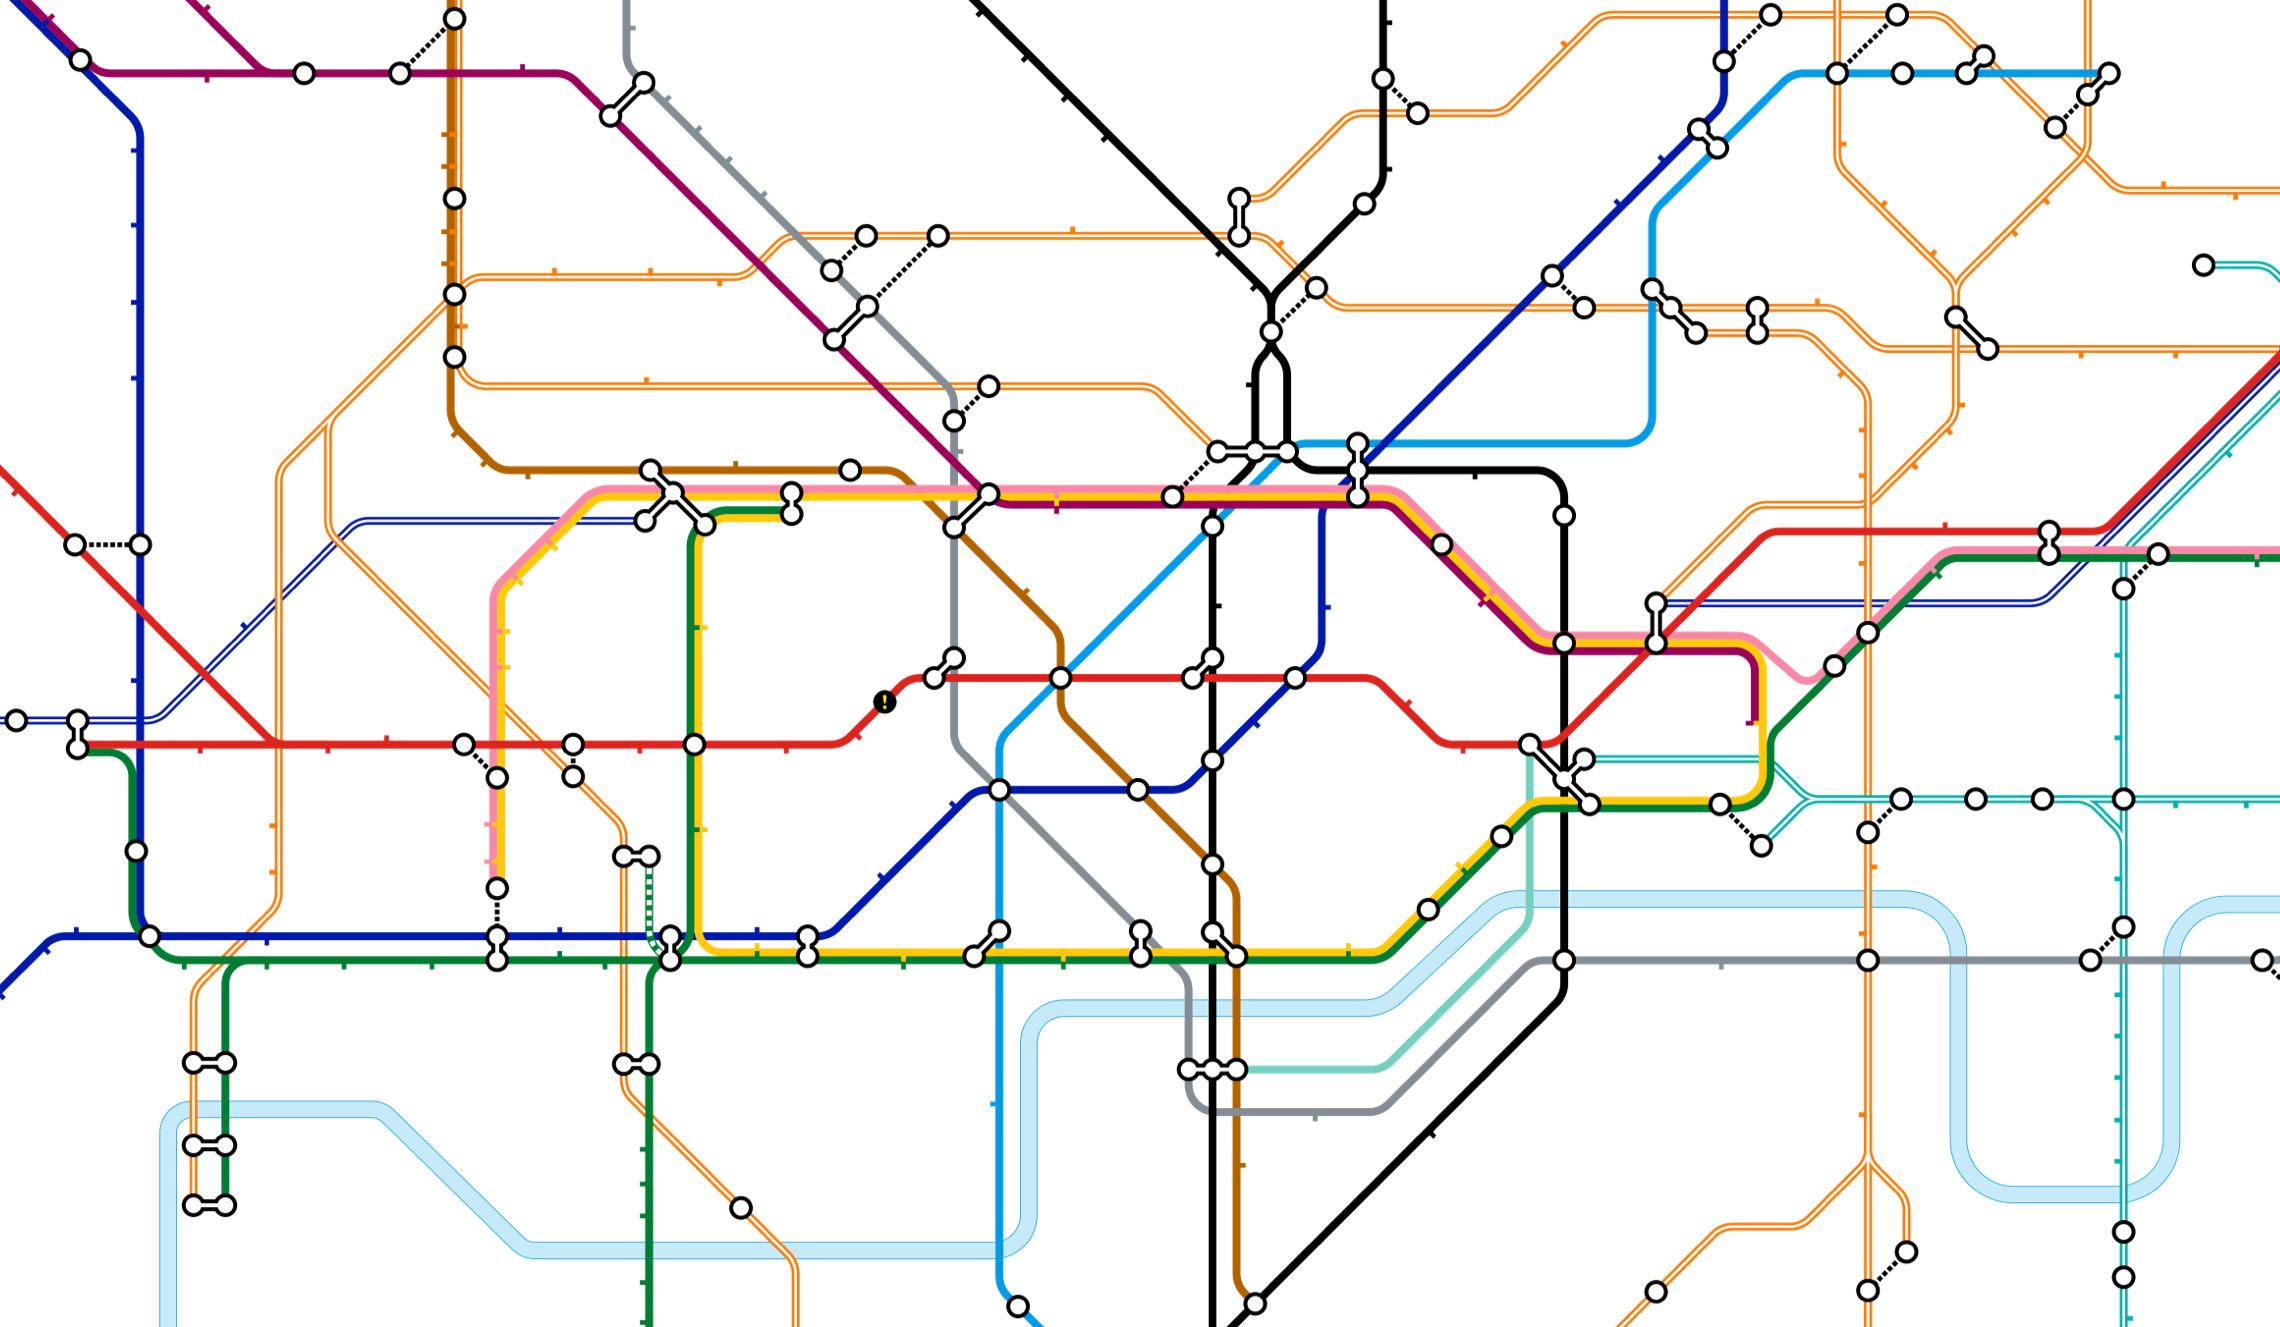
These days we all use graphs. Every time we use SatNav to plan a journey or Journey Planner to find our way into Central London, the route to our destination is in fact a route in a graph where each station, bus stop or public square is a point and every road we take or Tube line we ride describes a relationship between those points.
And yet, until recently, the way we stored this spatial data was in traditional, inappropriately named “relational” databases. These databases were designed at the time (we’re talking mid-20th century) to store records – long lists (‘tables’) of items such as products, employees, addresses etc. that may on occasion have relations to other items in other tables.
An employee may have a manager they report to, a customer may have a list of items in their shopping basket, an airline may have a list of destinations they fly to.
What happens though, when these relationships become complex and include several levels?
Relational databases, ironically, are not very good at handling complex chains of relations. So, if we wanted to build a social network website (another one?? Please don’t) and be able to say “these are Joe’s 3rd degree friends” (friends of friends of friends), things get very messy. These old databases are simply not fit-for-purpose when it comes to working their way through highly connected data.
The long and the shortest of it
Spatial data is one perfect example of highly connected data, where every point in a city may have half a dozen streets leading off it to hundreds of other points.
For a journey planning app to find us the shortest route from A to B, with possibly hundreds of steps along the route, it needs to explore the various routes available and figure out how everything links up.
This problem, known as a Graph Algorithm, was solved by several mathematicians, perhaps most famously by computer scientist Edsger Wybe Dijkstra. He found an efficient algorithm, which when used on spatial data, can figure out the shortest path between two points where each relationship is given a ‘weight’ (sometimes referred to as a ‘cost’).
In spatial terms this would translate to the distance in metres between two points, or perhaps the number of minutes or even travel cost, or a combination of all, such as for example “find me the shortest route to my destination that is also not too expensive”.
It may seem obvious to us that a journey planning app can figure out a walking or public transport route to our destination. If you know your way around the city, you could probably figure it out yourself. Consider though that a computer solving this problem is like a mouse in a maze: it cannot see the maze from above, all it sees is what its options are.
“Do I turn right or left? And then what? What do I do if that leads to a dead end?” This is exactly what shortest path algorithms are so good at. They not only solve the problem and find the shortest route, they also do it in remarkable time (milliseconds) even in extremely huge transport networks such as London.
Better yet, they can adapt to changing circumstances such as trains or buses being delayed, lifts going out of service or streets being closed. So long as the graph is updated with those live changes, the algorithms can recalculate an alternative best route.
Graph database technology to the rescue!
At TfL we have embraced graph databases as the backbone to our new accessible travel information. In TfL Go (find it in your app store if you’re not already using it) we provide live information about the availability of step-free stations across our network.
Live disruptions to lifts on the network will result in a platform appearing as currently not being step-free, unless the graph is able to figure out an alternative route to that platform (for example in a station such as King’s Cross, where often an alternative lift can be used to get to that platform, albeit in a longer route).
This is an exciting first stage in making richer and more detailed information available to all our customers, whether it is via an app or on screen at stations. The backbone behind this revolution is Pathfinder – our new graph database.